Dylan Nguyen
Data Engineer @Basware, Finland | AWS Certified Solution Architect and Data Analytics - Specialty | Master of Security and Cloud Computing (Security) @Aalto University
View My CV
View My LinkedIn Profile
Climate Change Dashboard
Keyword: Heroku, Flask, Plotly, Facebook Prophet, Python, XGBoost
Website - Project Report (pdf)
Project Description
This is a capstone project for Data Science Project (CS-C3250) course @Aalto University. The goal of this project was to produce a website that portrays climate change data smoothly to interested viewers. By using data points from multiple different sources, the site undoubtedly shares the most accurate and up-to-date information we could find. In order to accurately portray the effects climate change has had on the planet, we chose to illustrate data of CO2 emissions rising (along with other gases), the ice caps melting, which results in sea levels rising, the rising of temperatures, as well as included calculations that show how volcanic activity, El Niño, and other factors.
System Design
The website was built with a goal in mind to keep the architecture simple and hit the ground running as fast as possible. The Dashboard is hosted on Heroku hosting environment, due to its simplicity in deployment. Flask is used as a web server, and Plotly is used for interactive visualization.

Data Exploration
Modeling of the dependent variable is a difficult problem to solve, because of the complexity involved in separating the cause-effect relationship of the dependent variable, which is the global mean temperature, and independent variables,which are discussed later in this section, in an extremely complicated system powered by various different factors. In our studies, we look at the relationship between the global mean temperature, with 6 following time series:
- Atlantic Multidecadal Oscillation (AMO): This data series represents the mean SST of North Atlantic, i.e., within the latitude 0 °–70 °N, detrended to remove the influence of global warming.
- Greenhouse gases (CO2): The long-time yearly time series of the concentration of co2.
- North Atlantic Oscillation (NAO): An index calculated from the measurements of air pressure at two locations: Ponta Delgada, Azores, and Stykkisholmur/Reykjavik in Iceland.
- Sunspots Number (SSN): The number of sunspots.
- El Niño/Southern Oscillation (ENSO): Temperature fluctuations expressed by the average SST anomaly of the region 20 °N–20 °S minus 90 °N–20 °N and 20 °S–90 °S, relative to the base period 1950–1979. This has 3 separate time series., which include NINO1+2, NINO 3 and NINO4.
- Volcanic Explosivity Index (VEI): An index marking major volcanic explosions. The data frame contains 8 columns for the 6 independent time series (NINO has 3 different time series), 1 column for the dependent variable, and 1 column for the timestamp. Due to the difference in availability of data, the time frame is sliced to the period of 1st of January 1984 to 1st of February 2017. The correlation matrix of the data can be seen in the figure.
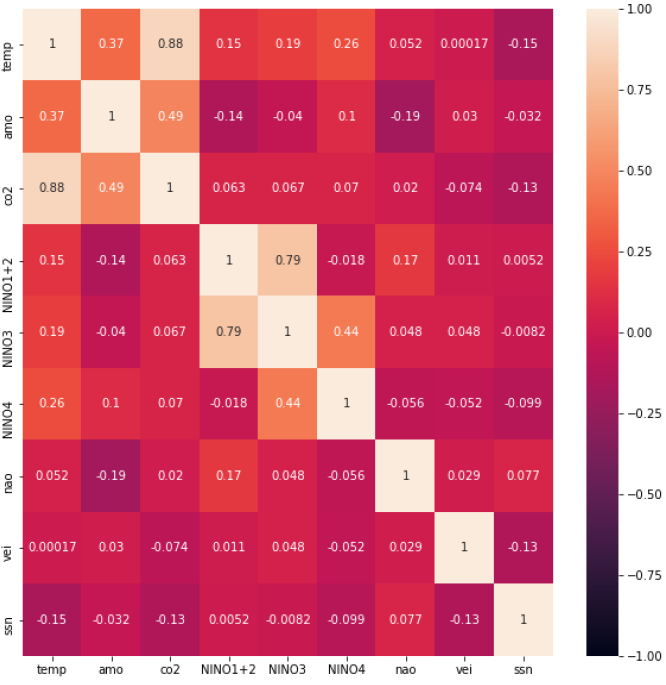
The figure shows the strongest correlation for the global temperature which is CO2, which is 0.88. The other time series correlation with temperature is non-significant. Furthermore, we also see a strong correlation between NINO1+2 and NINO3, suggesting multicollinearity in the ENSO’s 3 different time series.
FB Prophet Temperature Prediction
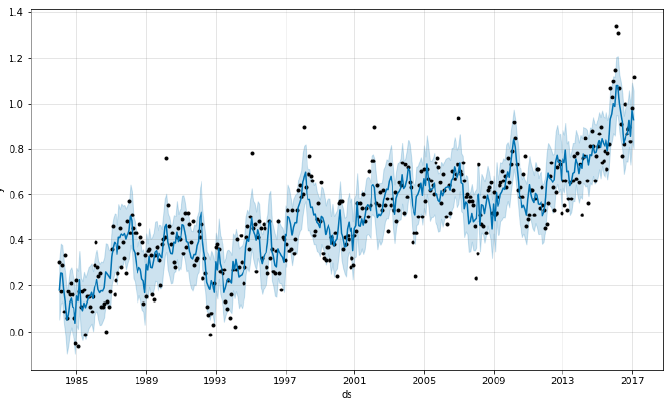
The data has 398 rows and 10 columns in total, which includes variables such as ‘ds’, ‘y’, ‘amo’, ‘co2’, ‘NINO1+2’, ‘NINO3’, ‘NINO4’, ‘nao’, ‘vei’, ‘ssn’. The naming convention are explained in the previous Correlation part. Due to the limited availability and poor quality of the data, the period of time in consideration was sliced down to 1984 - 2017. The train-test split was such that the train dataset was from January 1984 to December 2009, and the test set was on January 2010 to February 2017. The number of rows on the training set and test set are 312 and 86 rows, whose percentage on the total amount of rows are 78% and 22%.
The performance metrics of the models can be found in the appendix. Prophet performed best among the list of prediction methods that we looked at, with the lowest MAE and best PC score overall. This was due to the fact that Prophet was able to capture the trend, seasonality, as well as incorporating the lagged effects of the extra regressors into predicting the future values. From here, with the prophet model in mind, we performed a permutation test of the set of 8 variables, to determine the sets of variables that produce the best predictive powers with respect to the temperature dependent variable. In total, there are 2^8 distinct sets of different combinations of 8 variables. The performance of Prophet are reported in the appendix.
These are performance of the Prophet models which are trained with on the set of variables. Each of the “prior_” columns determines whether the time series are considered as an extra regressor in the model. From there, we can obtain a better understanding on which independent variables or set of variables provides the most predictive power for the temperature.
In the top 10 models, we can see that CO2 and NINO4 appeared 10 out of 10 times, indicating an individual effect or a pair effect on the prediction of the temperature.Atlantic Multidecadal Oscillation (AMO) and Sunspot number (SSN) and AMO donot appear anytime in the top 10 models. And the other time series appear 4-6 times. From here, we addressed the low power of the other time series by assigning them a low prior scale.
The hyper parameters of the final prophet model can be found in the appendix, which obtained the MAE of 0.076708 and Pearson Correlation of 0.848478. The temperature prediction of this model can be seen from the figure: